Smartsheet for Business – Spreadsheet-Based Project Management
For many professionals across every industry and organizational level, the spreadsheet is the ultimate
comfort zone of work management. Decades of accumulated muscle memory with rows, columns, formulas,
conditional formatting, pivot tables, and cell-based data organization have made the grid interface feel
like home base for managing information of any kind — from personal budgets and event planning to complex
project schedules and organizational resource tracking. Smartsheet was built on a simple but genuinely
powerful insight: if you could take that universally familiar grid interface and infuse it with genuine
project management capabilities — Gantt chart timelines with task dependencies, automated workflow rules,
resource tracking and workload visualization, collaborative features with real-time co-editing, and
enterprise-grade security and governance controls — you could create a platform that feels immediately
approachable and productive for spreadsheet-experienced professionals yet handles complex work management
scenarios that basic spreadsheets in Excel or Google Sheets cannot reliably support at scale.
Founded in 2005 and headquartered in Bellevue, Washington, Smartsheet has grown from a startup into a
significant and publicly traded player in the work management space, particularly among enterprise
organizations and mid-market companies that need substantially more structure, reliability, and
collaborative functionality than spreadsheets can provide but want a gentler, less disruptive learning curve
than full-fledged dedicated project management suites typically demand. The platform has expanded
considerably beyond its original spreadsheet roots, adding forms for external data collection, cross-sheet
reports for portfolio-level analysis, visual dashboards for stakeholder communication, portals for branded
project access, content management for digital asset workflows, enterprise resource management for capacity
planning, and sophisticated automation capabilities that position it as a comprehensive work execution
platform rather than merely an enhanced spreadsheet.
This review explores how Smartsheet approaches project management in daily practice, examines the specific
areas where its spreadsheet heritage creates genuine advantages over traditional project management tools,
identifies the trade-offs and limitations that come with building a project management platform on a grid
foundation, and helps you determine whether Smartsheet’s approach genuinely matches your team’s working
style and project management requirements.
The Familiar Grid Interface
Smartsheet’s primary interface is a grid that looks and feels remarkably similar to Microsoft Excel or Google
Sheets. You work with rows to represent tasks, milestones, or any discrete work items, and columns to
capture task attributes such as start date, end date, duration, assigned team member, percent complete,
current status, predecessor dependency relationships, and any custom fields you choose to define for your
specific workflow. Cells support formulas using a syntax that deliberately mirrors Excel’s formula language,
conditional formatting rules that automatically change cell appearance based on data values and threshold
conditions, and data validation rules that restrict inputs to acceptable values from defined lists or within
specified ranges.
This deliberate familiarity with existing spreadsheet interfaces is Smartsheet’s most potent and practically
significant onboarding advantage over every competitor. Team members who have spent years working in Excel
or Google Sheets can become genuinely productive in Smartsheet within minutes rather than the days or weeks
that more unconventional, unfamiliar platforms with novel interface paradigms typically require. They
already know intuitively how to navigate grid layouts, enter and edit data in cells, apply filters and
sorting rules to columns, create basic formulas using standard spreadsheet syntax, and use conditional
formatting to highlight important information visually. The fundamental interaction concepts are identical
to what they have been doing for years — Smartsheet simply adds project management intelligence,
collaborative capabilities, and workflow automation on top of the grid paradigm they already understand
without requiring them to learn an entirely new way of thinking about and interacting with work data.
The grid supports hierarchical organization through parent-child row relationships that create visual
structure and enable automatic data aggregation. Indenting a row transforms it into a child of the row
immediately above, creating expandable and collapsible task groupings that can represent project phases,
work breakdown structure elements, departmental responsibility areas, deliverable categories, or any other
logical hierarchy your team needs. Parent rows automatically calculate rollup values from their children —
if child task rows have durations, start dates, and end dates, the parent row automatically shows the
overall date range spanning all children, the aggregate total duration, and the weighted average progress
percentage across all child tasks. This automatic parent-child calculation extends natural spreadsheet
behavior in a way that experienced spreadsheet users understand intuitively without requiring explanation,
training, or documentation review.
Cell history tracking records every single change made to every cell throughout the entire sheet’s lifetime,
including exactly who made each change, precisely when the change occurred down to the minute, and what the
previous value was before the modification. This comprehensive audit trail addresses one of the most
critical and frustrating weaknesses of using traditional spreadsheets for project management — the inability
to track who changed what value, when the change was made, and what the previous value was before the
modification. In Smartsheet, you can always definitively answer the accountability question “who updated
this deadline, what was the original date before the change, and when exactly did that modification occur?”
— information that is essential for maintaining accountability, understanding how project plans evolve over
time, and resolving disputes about when and why schedule changes were made.

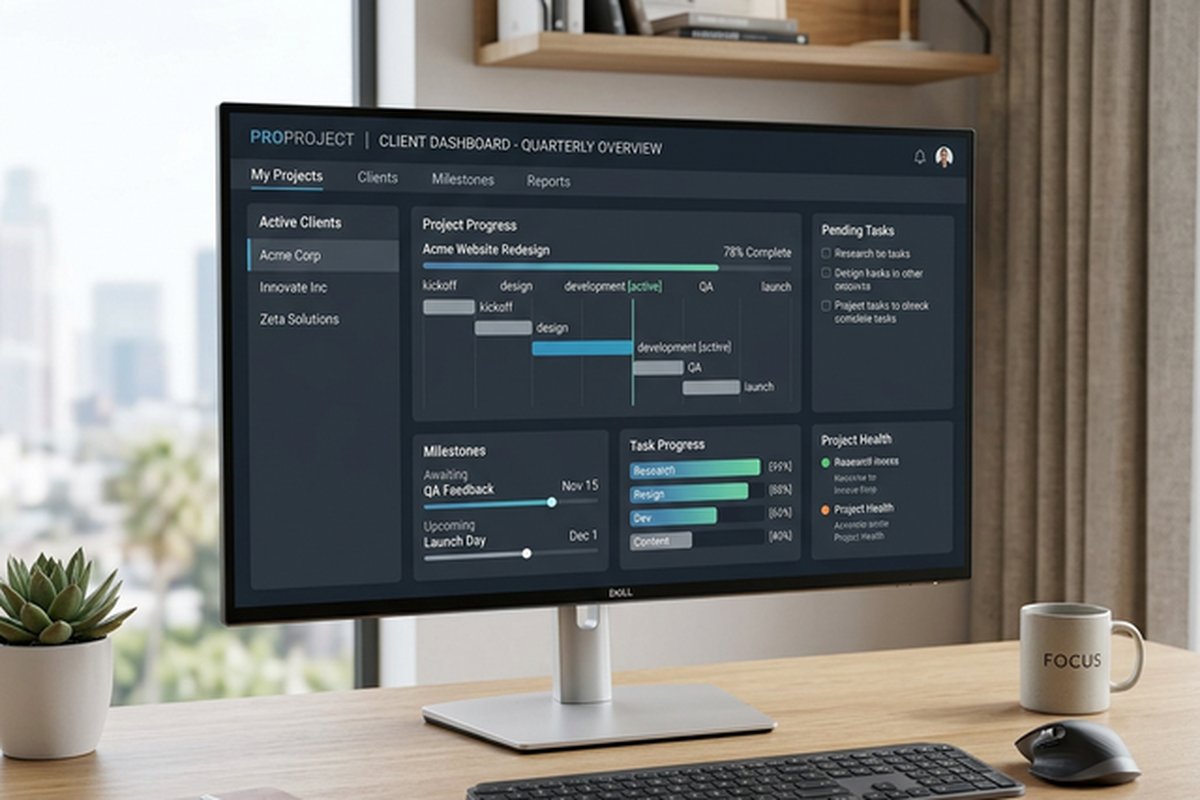
Gantt Chart Integration
Smartsheet’s Gantt chart sits alongside the grid view in a configurable split-screen layout where the left
side shows the familiar data grid and the right side shows the corresponding visual timeline representation
of the same data. This side-by-side arrangement creates an intuitive dual-panel experience — you can edit
task details, dates, durations, and dependencies in the grid cells and immediately see how those data
changes affect the visual timeline bars, or you can interact directly with the timeline by dragging task
bars and dependency arrows and immediately see the grid data update to reflect the visual changes.
The Gantt chart supports task dependencies with automatic schedule calculation using all four standard
dependency types: Finish-to-Start, Start-to-Start, Finish-to-Finish, and Start-to-Finish. When you create a
dependency between tasks by entering the predecessor row number in the designated predecessor column with an
optional dependency type indicator, the platform automatically calculates start and end dates for dependent
tasks based on the dependency chain logic, individual task durations, and your configured working day
calendar. If a predecessor task is delayed by three working days for any reason, all dependent successor
tasks automatically shift their calculated schedules forward by the same amount, cascading the schedule
adjustment through the entire dependency chain to all downstream tasks.
Critical path highlighting identifies and visually distinguishes the longest chain of sequentially dependent
tasks that determines the project’s minimum possible completion time. Any delay to any task on the critical
path directly extends the project’s calculated end date by exactly the same amount, making critical path
visibility essential for focusing management attention, resource allocation decisions, and risk mitigation
efforts on the specific tasks that carry the highest scheduling risk and the greatest downstream impact.
Tasks not on the critical path have calculated scheduling float — a quantified amount of scheduling
flexibility indicating how many days each task could slip without affecting the overall project deadline.
Baseline comparison allows you to save a complete snapshot of the original approved schedule and visually
compare it against the current active schedule as the project evolves through its execution phases. Baseline
bars appear as shadow bars positioned behind the current task bars on the Gantt chart, making schedule drift
immediately visible in terms of direction (whether the project is running ahead of or behind the original
plan) and magnitude (by how many days each task and the overall project have shifted). This visual
comparison communicates schedule health status more intuitively and more immediately than numerical date
comparisons presented in tabular formats, making it particularly effective for executive briefings and
stakeholder review meetings.
Automation Engine
Smartsheet’s automation capabilities have expanded significantly from the platform’s original spreadsheet
roots, evolving into a genuinely capable workflow automation engine that reduces the repetitive manual
administrative overhead associated with any project management practice.
The automation builder uses a visual workflow designer where you configure triggers, conditions, and
resulting actions without writing any code. Available triggers include row change events when specific
column values are modified, date-based conditions that fire when a date value is approaching within a
specified number of days, has arrived at the current date, or has passed beyond the current date, form
submission events when external or internal users submit structured information through a published
Smartsheet form, and scheduled recurrence intervals that fire daily, weekly, or monthly at specified times
regardless of data changes.
Available actions include sending formatted notification emails and structured approval request messages via
email or integrated Slack channels, recording timestamps automatically in designated cells when transitions
occur, locking rows permanently to prevent further editing after completion, moving or copying rows to other
sheets to route work between teams or archive completed items, clearing specific cell values for periodic
reset workflows, automatically assigning people to tasks based on conditional criteria, updating cell values
based on complex multi-condition logic, and creating new rows in other sheets for triggering downstream work
items. Conditions control whether actions execute, allowing complex logic such as sending a notification
only when the status column changes to Overdue AND the priority field equals High AND the assigned
collaborator belongs to a specific contact group.
Approval workflow automations deserve particular mention because they address a common business process need
that many competing project management tools handle poorly or not at all. You can configure automations that
send structured approval requests to designated managers or decision-makers when certain combinations of
conditions are met. The approval recipient can approve or deny the request directly from within the
notification email without ever logging into Smartsheet, and the platform automatically records the approval
decision with a timestamp and updates the originating sheet accordingly. For business processes like
purchase order approvals, content publication sign-offs, creative asset review cycles, budget exception
requests, or change order authorizations, this built-in approval mechanism eliminates the need for separate
approval routing tools and keeps complete decision audit trails attached to the work items they govern.
Reports, Dashboards, and Collaboration
Smartsheet’s reporting capabilities aggregate data across multiple separate sheets into consolidated views
that span project, team, and organizational boundaries. A single report can pull matching rows from numerous
different project sheets based on filter criteria you define, creating a unified cross-project view that
integrates information spanning multiple projects, departments, geographic regions, or any other
organizational dimension. A portfolio risk report might display all tasks across all project sheets where
the status is flagged as At Risk and the due date falls within the next fourteen days, regardless of which
specific project or team owns those tasks. A resource utilization report might show all tasks assigned to a
specific team member across every active project in the organization, revealing workload overlaps and
capacity conflicts that would be completely invisible when reviewing individual project sheets in isolation.
Dashboards combine configurable visual widgets displaying information from sheets, reports, and external
sources into unified summary displays. Available widget types include multiple chart formats (bar, pie,
line, column, and donut charts), metric display widgets showing key numbers or percentage values pulled from
specific cells, live report embeds displaying filtered data tables, branded images and logos, web content
iframes for embedding external tools and data sources, rich text blocks for narrative context and
instructions, and shortcut navigation panels with organized links to frequently accessed sheets and reports.
Dashboards update automatically as underlying sheet data changes, ensuring that the visual summaries always
reflect the current actual state of project work without manual refresh or scheduled report generation.
Collaboration features include granular sharing with five permission levels from Admin through Viewer,
row-level threaded comments with file attachments and team member mentions, document proofing for annotating
visual assets directly within the platform, and update requests that send simplified data collection forms
to specific people for targeted status updates without exposing the full sheet complexity.
Enterprise Capabilities and Advanced Features
Smartsheet has invested heavily in enterprise-grade features that extend far beyond its spreadsheet origins.
WorkApps enable business teams to build no-code applications from existing sheets, reports, and dashboards,
assembling them into polished, role-specific interfaces with controlled navigation, branded styling, and
granular permission settings that determine which users can view, edit, or interact with each component.
A project intake WorkApp might present a request form to business stakeholders, route submitted requests
through an approval workflow managed by department managers, display approved projects in a filtered
dashboard for the PMO, and provide a detailed execution tracking view for the assigned project team —
all built from existing Smartsheet data without writing a single line of code or purchasing separate
software.
Resource Management, available as an add-on for higher-tier plans, provides dedicated capacity planning
and utilization analysis capabilities. Resource managers can view team member availability across all
active projects, identify scheduling conflicts where the same person is assigned to overlapping
commitments, and model hypothetical staffing scenarios for proposed projects before committing resources.
Utilization reports show how productively the organization’s human resources are being deployed across
all tracked work, revealing under-utilized team members who represent available capacity and over-allocated
individuals who are at risk for burnout and delivery failures.
Forms provide a structured data collection mechanism where internal stakeholders, external clients, or
public users can submit information through a clean, branded interface that feeds directly into a
designated Smartsheet sheet. Form responses create new rows with validated, properly typed data that
avoids the quality issues that plague email-based and verbal request intake processes. Forms support
conditional logic that shows or hides fields based on previous answers, file upload fields for
collecting supporting documents and assets, and customizable confirmation messages or redirect URLs.
Administrative controls for enterprise deployment include SCIM user provisioning for automated account
lifecycle management through identity providers, SAML single sign-on for seamless authentication
integration, domain-level sharing controls that govern how data flows between internal and external
users, and compliance certifications covering SOC 2 Type II, HIPAA, FedRAMP, and ISO 27001 for
organizations operating in regulated industries with strict data governance requirements.
Strengths and Honest Limitations
Key strengths include rapid adoption through familiar spreadsheet interfaces that minimize the training
investment required for productive use, formula-driven intelligence for teams that think in calculations
and already have strong spreadsheet skills, data flexibility enabling quick restructuring and schema
modifications as project requirements evolve, cross-sheet formula capabilities spanning multiple project
data sources for portfolio-level calculations, and the approval workflow automations that address business
process needs many competitors do not handle natively. The combination of familiar interface and genuine
project management depth makes Smartsheet particularly effective for midmarket organizations and enterprise
teams that have outgrown their spreadsheet-based project tracking but want to preserve the working style
and analytical approach their teams have developed over years of spreadsheet use.
Limitations include a Kanban board experience less refined than board-native platforms like Trello where
the board view is the primary interface rather than a secondary visualization option, individual task
detail views that are less comprehensive than task-centric tools where each work item functions as a rich
page with embedded subtasks, discussions, and file galleries, and the non-trivial learning investment
required to master the sophisticated non-spreadsheet features — automations, cross-sheet references,
WorkApps, and Resource Management — that truly differentiate Smartsheet from having everyone continue
using basic spreadsheet applications that they already know how to use.
For teams evaluating alternatives with fundamentally different architectural approaches, our reviews of Airtable’s
database approach and Wrike’s
timeline focus provide contrasting perspectives on structured project tracking built on different
foundational paradigms.
Features and pricing referenced in this article are based on information available at the time of writing
and are subject to change. Please verify current details on the official Smartsheet website.