Wrike Gantt Charts – Timeline Planning and Resource Management
Timeline-based project planning is one of those capabilities that clearly separates casual task management
from serious, accountable project execution. When your work involves interdependent deliverables that must
be completed in specific sequences, multiple team members working in parallel on overlapping schedules,
fixed external deadlines that absolutely cannot slip without contractual or business consequences, and
limited specialized resources that need to be allocated carefully across competing priorities, a visual
timeline becomes not just a helpful organizational feature but the operational backbone of your entire
planning and execution workflow.
Wrike has positioned itself as a platform that takes timeline planning seriously and treats it as a
first-class core feature rather than a checkbox item added to satisfy a competitive comparison matrix. While
many project management tools include Gantt-style views as a feature that technically exists somewhere in
their interface but lacks the depth, interactivity, and integration needed for real project scheduling,
Wrike’s timeline capabilities are woven into the platform’s core functionality at a fundamental
architectural level. Task dependencies with automatic schedule cascading, critical path analysis and
visualization, resource workload management with capacity tracking, baseline schedule comparison,
cross-project timeline views, and integrated milestone tracking are not premium add-ons hidden behind
enterprise-tier pricing gates. They are central to how Wrike expects teams to plan, schedule, resource, and
execute complex work involving multiple people and interdependent deliverables.
This article examines Wrike’s Gantt chart and timeline features in comprehensive detail, exploring how they
function in day-to-day project management practice, what types of projects and teams benefit most from this
timeline-driven approach to work management, and where the platform’s scheduling capabilities stand relative
to what teams actually need for effective resource allocation, schedule management, and deadline
accountability.
Understanding Wrike’s Approach to Timeline Planning
Wrike structures work through a four-level hierarchy of Spaces, Folders, Projects, and Tasks. Spaces
represent broad organizational areas such as departments, clients, product lines, or geographic regions.
Folders and Projects group related work into manageable, focused containers within each space. Tasks are the
individual work items with assignees, start and end dates, effort estimates, descriptions, attachments, and
approval workflows. This hierarchical organization feeds directly into the platform’s Gantt chart
functionality because the timeline view can display work at any level of the hierarchy — from individual
task schedules within a single project to cross-project timelines spanning an entire organizational space
containing dozens of concurrent initiatives.
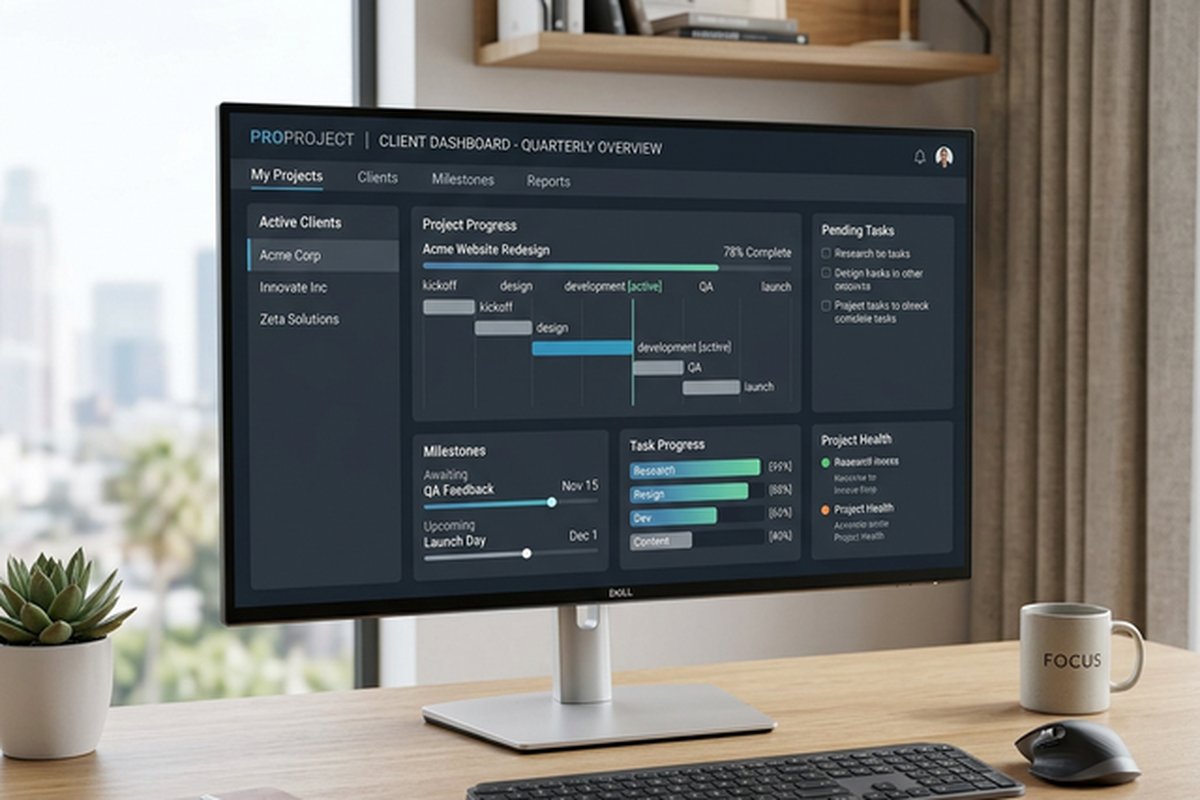
The Gantt chart in Wrike is not a static export or a read-only visualization generated from data entered in
some other part of the interface. It is a fully interactive planning surface where you can create new tasks
directly on the timeline by clicking and dragging to define start and end dates, adjust task durations by
dragging the left or right edges of existing task bars, establish dependency relationships by drawing visual
connection lines between tasks, reschedule work by moving entire task bars along the timeline, and modify
the project’s hierarchical structure through drag-and-drop operations directly within the visual timeline
context. Every change made in the Gantt view immediately and automatically updates the underlying task data,
and conversely, any modification made in list view, board view, the task detail panel, or through the mobile
app is instantly reflected back in the timeline display.
This bidirectional, real-time synchronization between the timeline view and all other views means the Gantt
chart is never a separate planning artifact that gradually drifts away from reality as the project
progresses through its execution phase. It is a continuously updated, living representation of your
project’s current state that reflects every status change, date modification, and resource reassignment the
moment it happens. This addresses one of the most common and most legitimate complaints about traditional
Gantt chart approaches in project management: that static timeline charts become outdated almost immediately
after they are created, require tedious and error-prone manual maintenance to keep aligned with actual
project progress, and eventually become so disconnected from reality that the team stops referring to them
entirely, losing the scheduling visibility that justified creating the chart in the first place.
Task Dependencies and Their Practical Impact
Dependencies define the sequential and parallel relationships between tasks, establishing which tasks must
complete before other tasks can begin, which tasks must run simultaneously, and which tasks have timing
relationships that link their starts and finishes. Managing dependencies correctly is the absolute
foundation of realistic project scheduling because without explicit dependency modeling, your timeline is
nothing more than a collection of independent date ranges that happen to appear on the same visual surface
without capturing the logical relationships that actually determine whether your schedule is achievable.
Wrike supports all four standard types of task dependencies recognized in professional project management
methodology. Finish-to-Start is the most common dependency type and means the successor task cannot start
until the predecessor task finishes. For example, user acceptance testing cannot begin until development and
internal quality assurance are complete and the feature is ready for external evaluation. Start-to-Start
means two tasks must start at the same time or the successor begins when the predecessor begins. For
example, documentation writing might begin when product design begins because the documentation captures
design decisions as they are made rather than waiting until design is finished. Finish-to-Finish means two
tasks must finish at the same time. For example, user documentation must be completed by the same date as
the software feature it describes, ensuring both are available simultaneously for a coordinated release.
Start-to-Finish is the least common type and means the predecessor must start before the successor can
finish, appearing in specialized scheduling scenarios such as just-in-time logistics and shift handover
coordination.
Creating dependencies in Wrike’s Gantt view is visually intuitive and requires no specialized training. You
click on one task bar, hold, and drag a connection arrow to another task bar. The platform draws a visible
connector line between the two tasks and immediately recalculates the schedule of all dependent tasks based
on the newly established relationship. If Task A is scheduled to finish on March fifteenth and Task B has a
Finish-to-Start dependency on Task A, Task B’s start date is automatically calculated as March sixteenth
(the next working day) and its end date is derived from that start date plus its defined duration. This
automatic calculation propagates through the entire dependency chain — if Task B feeds into Task C, and Task
C feeds into Task D, changing Task A’s duration by three days automatically pushes the start dates of Tasks
B, C, and D forward by three days each, giving you an immediate, honest, accurate view of how a single
schedule change cascades through the broader project timeline.
This automatic rescheduling functionality is simultaneously one of the most powerful and most potentially
alarming features in Wrike’s timeline view. On the positive side, it keeps your timeline honest and
realistic rather than displaying a visually attractive schedule that has already been invalidated by changes
your team may not have fully processed. On the cautionary side, a single date change to a heavily connected
task near the beginning of a long dependency chain can cascade through dozens or even hundreds of downstream
tasks, potentially pushing your overall project end date significantly further into the future than anyone
expected. Understanding the full dependency network and the implications of changes before making ad-hoc
date adjustments to high-connectivity tasks prevents surprising and demoralizing schedule shifts that can
undermine the team’s confidence in the plan.
Critical Path Visibility
The critical path is the longest sequence of dependent tasks that determines the minimum possible project
duration from start to finish. By definition, any delay to any task on the critical path directly and
unavoidably delays the project’s completion date by exactly the same amount. Tasks that are not on the
critical path have what project managers call scheduling float or slack — they can slip by some calculated
amount of time without affecting the overall project timeline, providing scheduling flexibility in how those
particular tasks are prioritized, resourced, and executed.
Wrike highlights the critical path in its Gantt view using distinct visual styling — typically bold red or
highlighted bars — that immediately and unmistakably differentiates critical path tasks from those with
scheduling flexibility. This visibility is invaluable for project managers because it definitively answers
the single most important scheduling question during project execution: Which specific tasks absolutely
cannot experience any delay whatsoever without directly pushing the overall project delivery date further
into the future?
Understanding which tasks sit on the critical path enables several categories of more intelligent management
decisions. Resource allocation decisions can prioritize staffing critical path tasks with the most reliable,
experienced, and focused team members while allowing more flexible staffing arrangements for tasks with
float. Schedule risk assessment can focus management attention and contingency planning on the specific
tasks where delays have the maximum downstream impact rather than spreading concern equally across all tasks
regardless of their scheduling significance. Scope change analysis can immediately quantify the timeline
impact of requested changes by determining whether the affected tasks sit on the critical path and, if so,
by how many days the change would extend the project’s minimum possible duration. These capabilities
transform project scheduling from intuitive guesswork into data-informed decision-making with quantifiable
impact analysis.
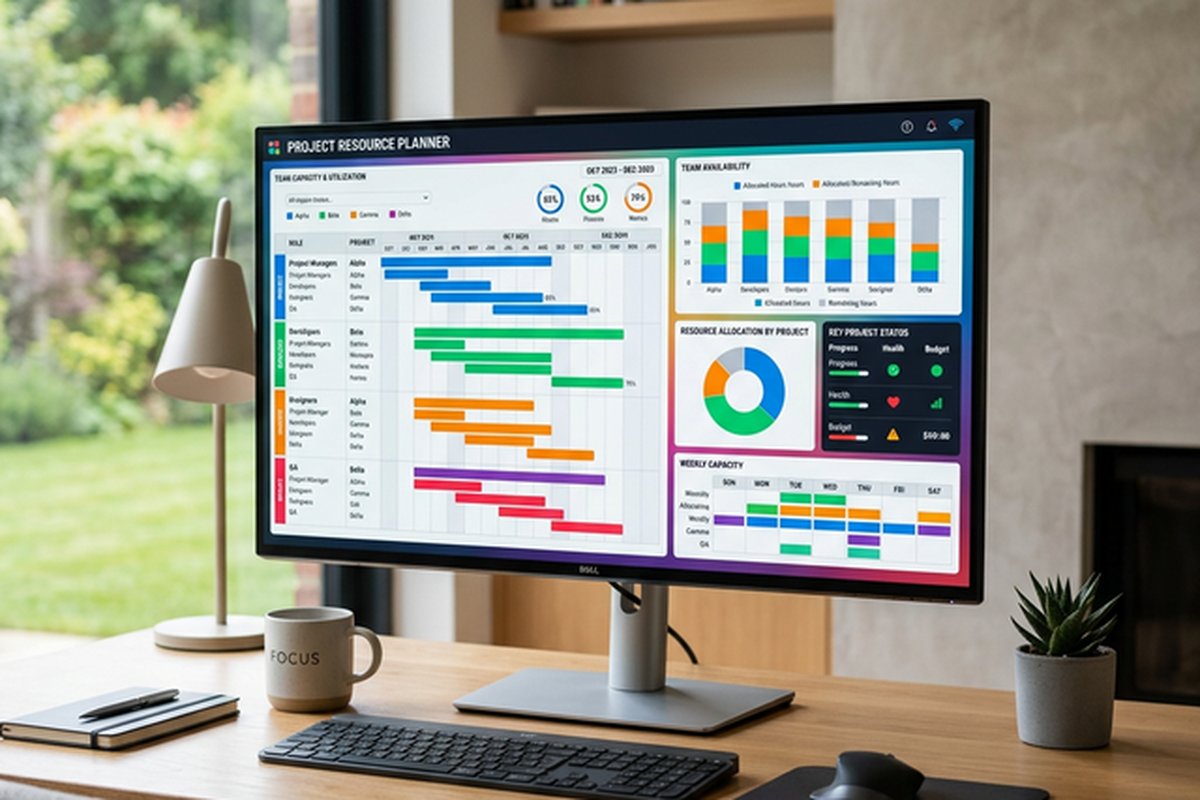
Resource Management and Workload Views
Timeline planning without resource awareness is an exercise in optimistic fiction. A beautifully scheduled
project plan that distributes every task perfectly across a calendar means absolutely nothing if the same
person is unknowingly assigned forty hours of parallel work on a single Tuesday, if three people are
scheduled for full-time project engagement when only two are actually available during that period, or if a
critical specialist is double-booked across two projects that both consider themselves the highest priority.
Wrike addresses this fundamental planning challenge through its integrated workload management capabilities,
which connect scheduling decisions directly to real resource availability and capacity.
Wrike’s Workload View displays team members along one axis and time periods along the other, showing the
volume of work assigned to each person within each time interval. Work volume can be measured either by
simple task count or by effort hours if your team maintains time estimates on tasks. When a team member’s
assigned work exceeds their defined available capacity for a given period, the platform flags the
overallocation with clear visual color indicators — typically showing the overallocated period in red or
orange — making resource bottlenecks immediately visible through passive scanning rather than requiring
active investigation through spreadsheets, capacity tracking documents, or one-on-one check-ins with every
team member.
This proactive workload visibility allows managers to identify and resolve resource bottlenecks before they
manifest as missed deadlines, quality problems, and team member burnout. If one designer has three
overlapping project deadlines converging in the same week while another designer has open capacity during
that same period, the workload view makes this imbalance immediately and unmistakably obvious at a glance,
enabling immediate rebalancing through task reassignment or rescheduling. Tasks can be reassigned or
rescheduled directly from the workload view through drag-and-drop interactions, and the Gantt chart updates
automatically to reflect resource changes and any resulting schedule adjustments.
Effort estimation adds a crucial dimension of accuracy to resource planning that simple task counting cannot
provide. When tasks include estimated hours as part of their setup, Wrike calculates whether the total
planned effort exceeds each team member’s available hours for any given week or day. This moves resource
management beyond simply counting assigned tasks to actually modeling the time commitment each task
represents. This distinction matters enormously because a single task estimated at forty hours and a single
task estimated at thirty minutes have identical impact when counted as tasks but have vastly different
implications for a person’s actual available capacity that week.
For teams managing resources across multiple simultaneous projects, Wrike’s cross-project workload visibility
is particularly valuable and genuinely difficult to replicate effectively in competing tools that do not
offer portfolio-level resource views. A designer might appear to have perfectly manageable workloads when
you examine each of their assigned projects individually in isolation, but be significantly and
unsustainably overallocated when you add up their total commitments across all active projects
simultaneously. Only a cross-project resource view reveals this kind of hidden over-commitment pattern that
consistently leads to missed deadlines, declining quality, and eventual team member burnout.
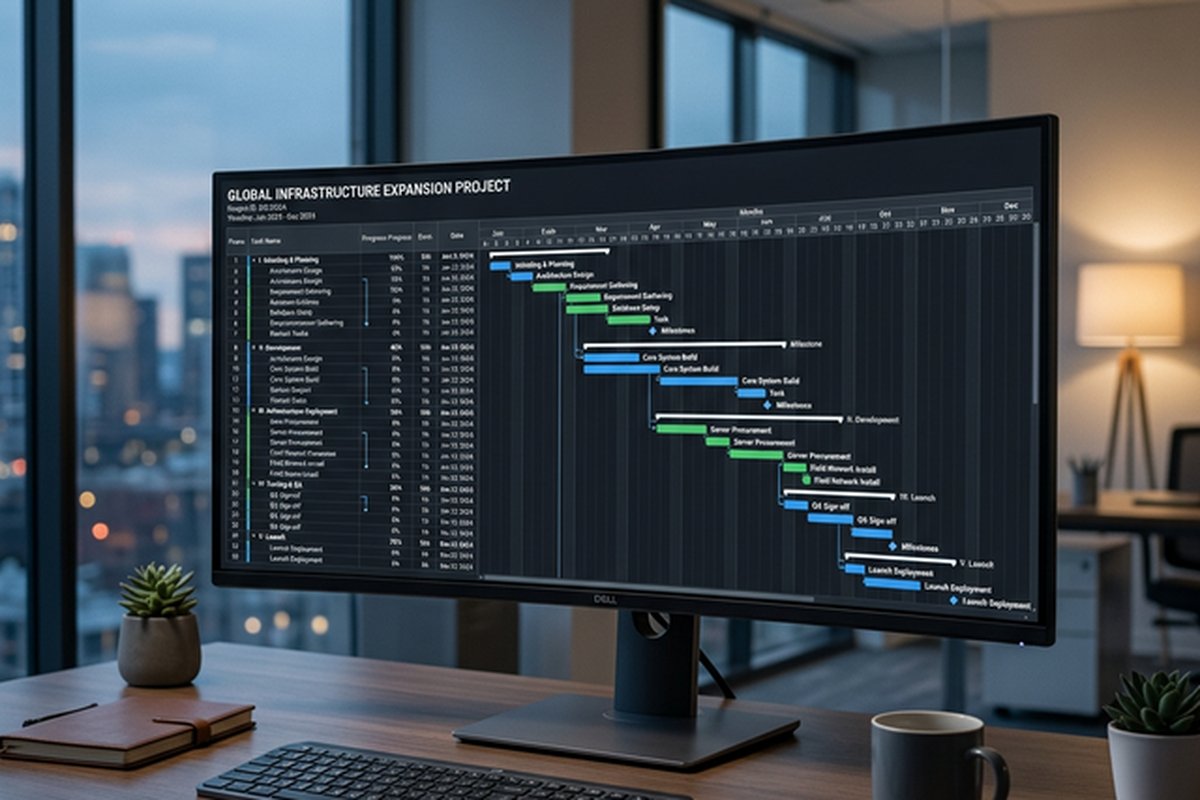
Milestones, Baselines, and Progress Tracking
Milestones in the Gantt view serve as zero-duration markers that represent significant project checkpoints
including deliverable due dates, executive review gates, go-live dates, budget approval deadlines,
contractual milestone dates, or any other event that carries strategic importance and external visibility.
Using milestones effectively provides a high-level skeletal structure for your timeline that communicates
the overall project rhythm, major deadlines, and critical decision points at a glance, even when the full
detail of individual tasks between milestones is collapsed and hidden.
Baselines capture complete schedule snapshots at specific points — typically when the initial project plan
receives formal approval from stakeholders. As the project progresses and actual dates inevitably begin
diverging from the original plan, Wrike displays baseline bars as shadow markers behind the current task
bars on the Gantt chart. If a task’s current schedule shows it finishing two weeks later than the baseline
originally planned, the visual gap between the two bars makes the magnitude, direction, and pattern of
schedule drift immediately visible, intuitively understandable, and impossible to overlook or dismiss. This
visual baseline comparison communicates schedule health more effectively and more intuitively than tables of
numerical date comparisons, making it the preferred format for stakeholder presentations and project review
conversations.
Broader Platform Context
Wrike’s Gantt chart functionality exists within a comprehensive platform that includes board views for
Kanban-style workflow management, customizable dashboards with real-time charts and status summaries,
structured request forms for standardized work intake from internal and external stakeholders, configurable
automation rules for reducing manual status updates and notification routing, custom item types and
workflows for modeling different work categories, and extensive third-party integrations with tools
including Slack, Microsoft Teams, Google Workspace, Salesforce, Adobe Creative Cloud, GitHub, and over four
hundred other platforms through native connections and marketplace apps.
Custom item types allow teams to define distinct work categories beyond standard tasks — for example,
separating deliverables, milestones, bugs, and requests into different item types with unique field
configurations and dedicated workflow statuses for each type. This structural distinction helps teams
manage diverse work portfolios where different categories require different tracking attributes, approval
processes, and completion criteria. Visual proofing capabilities enable stakeholders to annotate images,
PDFs, and creative assets with spatially-anchored feedback comments directly within the platform, reducing
the confusion and revision cycles that accompany creative review processes when feedback is communicated
through disconnected text descriptions.
Pricing spans multiple tiers with progressively more features at each level. Gantt chart functionality, task
dependencies, and resource management are available on certain paid tiers, while the free plan offers basic
task management without timeline capabilities. Teams interested in timeline planning should verify which
specific plan tier includes the Gantt, dependency, and resource management features they need before
committing.
For teams with simpler planning needs that do not require complex dependency modeling or resource capacity
analysis, lighter-weight project management tools like Trello
or Notion
may provide adequate project tracking without the overhead of maintaining a full dependency network and
resource model.
Features and pricing referenced in this article are based on information available at the time of writing
and are subject to change. Please verify current details on the official Wrike website.